How to debug OOM? Development phase is over, application has been tested by QA and moved to Prod. It runs fine/up for first few days or even month. Suddenly it stops with OOM. Some careful step by step analysis will help to solve this kind of problem.
Suspects:
1. Check log to understand what happened at the time of OOM, was there any particular functionality executed many times?
2. Is there any change in load? has it been increased in past days?
3. What are all new changes done to application?
4. Is there any specific changes to hardware?
5. Any other new application deployed into the same box recently which consumes your application memory also?
Above questions would give some clue on what could be the reason?
1. If it is some functionality and that leads to OOM, then go through the functionality and try to get how the objects are kept in memory.
For example, might have assumed always we need to get the details from 2KB files, so lets load them into memory and get details from that. But over a period of time this could have increased to 10MB?
2. System load can be mostly collected from the run time details / even from the log. Get the snapshot of CPU usage and memory usage from Production management team (like, UNIX command top snapshot)? Database entries also gives fair amount of load, like how many entity has been added today?
3. Definitely new changes might be the root cause, if the application is not new. Carefully go through each functionality added to last release?
4. Check with the Production Management team about the hardware changes / patch releases to OS / upgradation? any of this can also cause
Reproduce:
Based on suspect develop test application
1. Each suspect need to be verified in similar environment
2. If it is load issue, find out heavy weight functionality and load test. Increase load step by step (like, 20 clients 1000 requests then 40 clients 2000 requests)
Analysis
Once the problem has been reproduced in your environment, find out the pattern. Most of the issues occur because of memory allocation versus how your GC is able to reallocate memory back. This can be analysed by collecting GC verbose. There are lot of options available with JVM options (click on this link to get the details) to collect GC details.
Note: Some of the JVM might vary, so refer JVM documentation for the particular vendor
Common option is
nohup java -Xverbosegc:file=testgc.vgc com.test.TestServer > test.out &
Executing this will store the GC collection metrics in testgc.vgc file. Run your load test.
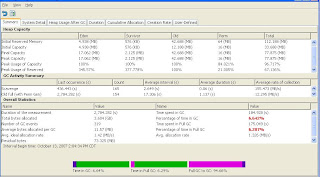
Once completed there are numerous tools available to analyse GC details. I used HPJmeter and download is available in this URL.
This tool will provide details of your application memory management details and how GC works on your application run time? We can get,
1. Heap usage
2. Scavenge
3. Full GC (Perm gen)
4. Object creation rate
5. How many times scavenge and full gc executed
6. How much reclaimed each stage

Solution:
We can fix code and release it, but how long this problem is going to wait? Are you ready to face CNN interview? We need short term solution. This can be either,
1. Increasing heap memory
2. Tuning configuration parameters (JVM options)
a. can specify what kind of algorithm can be used? (ex, -XX:+UseParNewGC -XX:+UseConcMarkSweepGC -XX:+CMSIncrementalMode -XX:+UseTLAB)
b. how much memory needed for tenure (ex, -XX:MaxTenuringThreshold=40)
c. How long it needs to stay in scavenge (ex, -XX:SurvivorRatio=2)
d. Most importantly check, is it enabled for server mode (ex, -server)
3. Tune application level configuration (ex, in one case, we could solve the problem by just decreasing logging level)
Confirm stability:
Now based on your above solution, apply in your environment and run test again. Collect GC details and compare with the OOM result
Most of the tools provide compare option and more over memory allocation and CPU usage can be monitored using top command in UNIX/LINUX.
Heap Memory comparison result, Red indicates OOM issue process
Object creation rate graph comparison
Steps to be taken care:
1. This has given great insight of the application, store this metrics in your repository for further tuning.
2. Include the scenario to load test. Once OOM occur, that application moves to hot seat, so every release plan to run stress and load test
3. This is clear indication that, your application need to go through profiler.


No comments:
Post a Comment