In my previous post "Backward compatibility of webservice" talked about different tool to verify backward compatibility of webservice API. JDIFF does not include classes under default build path. But wsdl2java tool (WebMethods Glue) generates creates interface under default classpath when server side package option is selected (-P). So this has to be moved another package, I found a way to do this using ant task. We do not have really have direct way to do, but with move & replace tasks help to achieve this.
<!-- Add package -->
<replace file="${TEST_HOME}/src/TestAdmin.java">
<replacetoken>public interface TestAdmin</replacetoken>
<replacevalue> package com.test;
public interface TestAdmin </replacevalue>
</replace>
<!-- Move TestAdmin.java under com.test package -->
<move file="${TEST_HOME}/src/TestAdmin.java" todir="${TEST_HOME}/src/com/test"/>
Now compilation and generating JDiff reports work great
Friday, October 26, 2007
Thursday, October 25, 2007
WebService Backward compatibility - Tool to verify
SOA is great way to loosely couple application in enterprise world. But this becomes complicated when we needed to maintain multiple versions.
We hit by similar incidents twice in this month. How to solve this?
I looked into multiple way to check backward compatibility, nothing is 100% good. So had to come up with hybrid approach to solve with couple of tools
1. JPEP - it is a good tool, but had to write code to check field level changes.
2. JDIFF - provides nice report, but we need to manually verify report.
I have written ant script to compare wsdl using both of the above tools
1. Create java files from old version wsdl, using wsdl2java glue command
2. Create java files from new version wsdl using wsdl2java glue command
3. Call JDIFF ant task and pass old and new version java source folders (this creates report)
4. Compile old version and create jar file
5. Compile new version and create jar file
6. Call JPEP java class by passing old jar and new jar. Note: This tool is not 100% complete, i needed to write code for comparing fields
Now this comparison takes just 30 secs to complete. Hiiii.... hooooo..... Analyse result and fix accordingly.
Sources:
1. JDiff Download
2. JPEP Download
3. Japitools
4. BackCompatability
Read below articles on webservice visioning best practices:
http://webservices.sys-con.com/read/44356.htm
http://www.ibm.com/developerworks/webservices/library/ws-version/
- We don't know how many components using the application?
- when are they planning to upgrade?
- is it in sunset mode?
- Anyway we need to maintain version, what happens when we needed to change one functionality / underlying operation?
- What happens if we accidentally modified some interface / added new field?
We hit by similar incidents twice in this month. How to solve this?
I looked into multiple way to check backward compatibility, nothing is 100% good. So had to come up with hybrid approach to solve with couple of tools
1. JPEP - it is a good tool, but had to write code to check field level changes.
2. JDIFF - provides nice report, but we need to manually verify report.
I have written ant script to compare wsdl using both of the above tools
1. Create java files from old version wsdl, using wsdl2java glue command
2. Create java files from new version wsdl using wsdl2java glue command
3. Call JDIFF ant task and pass old and new version java source folders (this creates report)
4. Compile old version and create jar file
5. Compile new version and create jar file
6. Call JPEP java class by passing old jar and new jar. Note: This tool is not 100% complete, i needed to write code for comparing fields
Now this comparison takes just 30 secs to complete. Hiiii.... hooooo..... Analyse result and fix accordingly.
Sources:
1. JDiff Download
2. JPEP Download
3. Japitools
4. BackCompatability
Read below articles on webservice visioning best practices:
http://webservices.sys-con.com/read/44356.htm
http://www.ibm.com/developerworks/webservices/library/ws-version/
Monday, October 22, 2007
Build automation - Ant, Maven and Continuum
Working with global team use to be much complex before than now. When we started global development team for a product, following are main issues with the process we faced
- How to maintain code base, access single repository. I remember we schedule time for moving files into repository and check-out, in our project plan. Then we come up with replication model, but this is also complicated when we take build. Always need to check the files are latest / still some member are working on the product
- Build process is also need to be in same place (WAN / LAN) with the repository. Otherwise it would take hours to complete build. We needed remote access to build process too.
So we were introduced to ant build process in 2001.
- First started with just an ant build process (without fetching files from repository)
- Enhanced to fetch files from repository
- Developed custom web application which manages build process and sends mails on build process
Then onwards we started following same process for all our projects. Its streamlined and works great.
Recently we have moved from old repository to open source subversion. It is great for development and make build process simple.
We are moving into Maven and planning to integrate with CI. I found following sources are useful and I could complete setup within 2 hours.
- Maven - link : These steps are very easy to follow "Getting started"
- CI - Build automation - Comparison document (great one)
- I found continuum is powerful and easy to integrate with any type of build process and repository
See all the great features of build history, manual execution, scheduling, build dependency, report generation and notification.
Now this need to be moved step by step without distrubing existing process.
- Move simple build process like stand alone application into maven
- integrate with Continuum
- Find out the suitability and stablility
Then follow same phases for other application like webapps and ear.
Saturday, October 20, 2007
Cache framework - Java
We always need to fight with performance and memory usage to tune application for best result. When we talk about performance, cache helps to speed up process instead of getting data from database / distributed application / file system every time. But we cannot keep stale data to process transactions, it needs to be loaded time to time.
1. Based on sensitivity of data and type of transaction, this cache need to be refreshed to get fesh data. This can be achieved by writing code with timer which handles flushing data from memory every x time period.
2. Application need some data to be refreshed frequently, some need to be refreshed once a day. So cache should be able to load different type of data based on configurable time.
There are lot of open source cache solution available in market, I found this link very interesting. I decided to use ehCache for our application, because it uses SelfPopulating design pattern, to load data automatically once it expires.
Below steps explains step by step coding steps,
Business problem: Category table values changes less frequently in application, so application can keep this in memory for operations and this need to be refreshed every five minutes to avoid stale data.
Result:
1. Based on sensitivity of data and type of transaction, this cache need to be refreshed to get fesh data. This can be achieved by writing code with timer which handles flushing data from memory every x time period.
2. Application need some data to be refreshed frequently, some need to be refreshed once a day. So cache should be able to load different type of data based on configurable time.
There are lot of open source cache solution available in market, I found this link very interesting. I decided to use ehCache for our application, because it uses SelfPopulating design pattern, to load data automatically once it expires.
Below steps explains step by step coding steps,
Business problem: Category table values changes less frequently in application, so application can keep this in memory for operations and this need to be refreshed every five minutes to avoid stale data.
- Define a class which implements CacheEntryFactory (refer FactoryPattern – CacheFactory.java) – this is the class which loads data from Database
- Write a Singleton to initialize and get the values from cache CacheLoader – Add logic to use SelfPopulatingCache. This class will load new values whenever the object expires and added back again.
- Configure ecache.xml to specify the cache name and time period
- Test program (how to get the values – TestCache.java )
Step 1: Download ehcache code from repository . Keep ehcache-x.x.x.jar and commons-logging.jar as part of application lib folder
Step 2: Create java class CacheFactory.java which defines code to connect to java and get the result
package com.test.cache;

import java.util.HashSet;
import java.util.Hashtable;
import net.sf.ehcache.constructs.blocking.CacheEntryFactory;

public class CacheFactory implements CacheEntryFactory {

 public Object createEntry(Object key) throws Exception {
  if("catagory".equals(key))
   return loadCatagory();
  else if("country".equals(key))
      return loadCountry();
     return null;
 }

 public static HashSet loadCatagory(){
  System.out.println("Calling and populating Catagory");
  HashSet catagoryHashSet = new HashSet();
  //Your DB code goes here
  catagoryHashSet.add("veg");
  catagoryHashSet.add("fruit");
  return catagoryHashSet;
 }

 private static Hashtable loadCountry(){
  System.out.println("Calling and populating Country");
  Hashtable countryHashtable = new Hashtable();
  //Your DB code goes here
  countryHashtable.put("01", "USA");
  countryHashtable.put("91", "India");
  return countryHashtable;
 }
}
Step 3: Create java class CacheLoader.java singleton which loads object using cache loader
package com.test.cache;

import net.sf.ehcache.CacheManager;
import net.sf.ehcache.Ehcache;
import net.sf.ehcache.constructs.blocking.SelfPopulatingCache;

public class CacheLoader {

 private static CacheLoader cacheLoader = null;
 protected CacheManager manager;
 protected SelfPopulatingCache selfPopulatingCache;
 protected Ehcache cache;

 private CacheLoader(){
  manager = new CacheManager();
  cache = manager.getCache("CACHETEST");
  selfPopulatingCache = new SelfPopulatingCache(cache, new CacheFactory());
 }

 public static CacheLoader getInstance(){
  synchronized(CacheLoader.class){
   if(cacheLoader == null){
    cacheLoader = new CacheLoader();
   }
  }
  return cacheLoader;
 }

 public Object get(Object key){
  return selfPopulatingCache.get(key);
 }

 public void refresh(){
  selfPopulatingCache.refresh();
 }

}
Step 4: Place ecahce.xml under classpath and define cache name and time to live, here i have set 4 seconds
<ehcache xmlns:xsi="http://www.w3.org/2001/XMLSchema-instance" xsi:noNamespaceSchemaLocation="ehcache.xsd">
    <diskStore path="java.io.tmpdir"/>
    <cacheManagerEventListenerFactory class="" properties=""/>
    <!--
    Mandatory Default Cache configuration. These settings will be applied to caches
    created programmtically using CacheManager.add(String cacheName).
    The defaultCache has an implicit name "default" which is a reserved cache name.
    -->
    <defaultCache
            maxElementsInMemory="10000"
            eternal="false"
            timeToIdleSeconds="120"
            timeToLiveSeconds="120"
            overflowToDisk="true"
            diskSpoolBufferSizeMB="30"
            maxElementsOnDisk="10000000"
            diskPersistent="false"
            diskExpiryThreadIntervalSeconds="120"
            memoryStoreEvictionPolicy="LRU"
            />
     <cache name="CACHETEST"
           maxElementsInMemory="100"
           timeToIdleSeconds="4"
           timeToLiveSeconds="4"
           eternal="false"
           overflowToDisk="false"
           memoryStoreEvictionPolicy="FIFO"
            />
</ehcache>
Step 5: Write Test class TestCache.java which calls CacheLoader class to get values with 1 sec delay. Method gets executed only after 4 secs, check "Calling and populating Catagory" message.
package com.test.cache;
package com.test.cache;

public class TestCache {
 public static void main(String[] arg) throws Exception{

  for(int i = 0 ; i < 10 ; i++ ){
   System.out.println(CacheLoader.getInstance().get("catagory"));
   System.out.println(CacheLoader.getInstance().get("country"));
   Thread.sleep(1000);
  }
 }
}
Result:
Calling and populating Catagory
[ key = catagory, value=[veg, fruit], version=1, hitCount=0, CreationTime = 1192975672420, LastAccessTime = 0 ]
Calling and populating Country
[ key = country, value={01=USA, 91=India}, version=1, hitCount=0, CreationTime = 1192975672420, LastAccessTime = 0 ]
[ key = catagory, value=[veg, fruit], version=1, hitCount=1, CreationTime = 1192975672420, LastAccessTime = 1192975673421 ]
[ key = country, value={01=USA, 91=India}, version=1, hitCount=1, CreationTime = 1192975672420, LastAccessTime = 1192975673421 ]
[ key = catagory, value=[veg, fruit], version=1, hitCount=2, CreationTime = 1192975672420, LastAccessTime = 1192975674412 ]
[ key = country, value={01=USA, 91=India}, version=1, hitCount=2, CreationTime = 1192975672420, LastAccessTime = 1192975674412 ]
[ key = catagory, value=[veg, fruit], version=1, hitCount=3, CreationTime = 1192975672420, LastAccessTime = 1192975675414 ]
[ key = country, value={01=USA, 91=India}, version=1, hitCount=3, CreationTime = 1192975672420, LastAccessTime = 1192975675414 ]
[ key = catagory, value=[veg, fruit], version=1, hitCount=4, CreationTime = 1192975672420, LastAccessTime = 1192975676415 ]
[ key = country, value={01=USA, 91=India}, version=1, hitCount=4, CreationTime = 1192975672420, LastAccessTime = 1192975676415 ]
Calling and populating Catagory
[ key = catagory, value=[veg, fruit], version=1, hitCount=0, CreationTime = 1192975677417, LastAccessTime = 0 ]
Calling and populating Country
[ key = country, value={01=USA, 91=India}, version=1, hitCount=0, CreationTime = 1192975677427, LastAccessTime = 0 ]
[ key = catagory, value=[veg, fruit], version=1, hitCount=1, CreationTime = 1192975677417, LastAccessTime = 1192975678428 ]
[ key = country, value={01=USA, 91=India}, version=1, hitCount=1, CreationTime = 1192975677427, LastAccessTime = 1192975678428 ]
[ key = catagory, value=[veg, fruit], version=1, hitCount=2, CreationTime = 1192975677417, LastAccessTime = 1192975679430 ]
[ key = country, value={01=USA, 91=India}, version=1, hitCount=2, CreationTime = 1192975677427, LastAccessTime = 1192975679430 ]
[ key = catagory, value=[veg, fruit], version=1, hitCount=3, CreationTime = 1192975677417, LastAccessTime = 1192975680431 ]
[ key = country, value={01=USA, 91=India}, version=1, hitCount=3, CreationTime = 1192975677427, LastAccessTime = 1192975680431 ]
Calling and populating Catagory
[ key = catagory, value=[veg, fruit], version=1, hitCount=0, CreationTime = 1192975681433, LastAccessTime = 0 ]
Calling and populating Country
[ key = country, value={01=USA, 91=India}, version=1, hitCount=0, CreationTime = 1192975681433, LastAccessTime = 0 ]
Conclusion:
Multiple cache can be defined in ecache.xml and can be used easily. This keeps cache code clearly separated from main business logic in application.
Friday, October 19, 2007
Memory leak - OOM analysis based on GC
Are you writing code using C / C++, oh hooo you have to worry about all memory management? Move on to Java, you need not worry about memory management / JVM takes care for you. Don't believe this if some one says like this. Yes JVM takes care of memory management using GC (Garbage collection) but this is also based on certain algorithm. If your application creates lot of long living object and very few short living object (or) lot of short living object and some long living object then you may have to tune your JVM to take care of this. Lets see how to tune JVM parameter later.
How to debug OOM? Development phase is over, application has been tested by QA and moved to Prod. It runs fine/up for first few days or even month. Suddenly it stops with OOM. Some careful step by step analysis will help to solve this kind of problem.
Suspects:
1. Check log to understand what happened at the time of OOM, was there any particular functionality executed many times?
2. Is there any change in load? has it been increased in past days?
3. What are all new changes done to application?
4. Is there any specific changes to hardware?
5. Any other new application deployed into the same box recently which consumes your application memory also?
Above questions would give some clue on what could be the reason?
1. If it is some functionality and that leads to OOM, then go through the functionality and try to get how the objects are kept in memory.
For example, might have assumed always we need to get the details from 2KB files, so lets load them into memory and get details from that. But over a period of time this could have increased to 10MB?
2. System load can be mostly collected from the run time details / even from the log. Get the snapshot of CPU usage and memory usage from Production management team (like, UNIX command top snapshot)? Database entries also gives fair amount of load, like how many entity has been added today?
3. Definitely new changes might be the root cause, if the application is not new. Carefully go through each functionality added to last release?
4. Check with the Production Management team about the hardware changes / patch releases to OS / upgradation? any of this can also cause
Reproduce:
Based on suspect develop test application
1. Each suspect need to be verified in similar environment
2. If it is load issue, find out heavy weight functionality and load test. Increase load step by step (like, 20 clients 1000 requests then 40 clients 2000 requests)
Analysis
Once the problem has been reproduced in your environment, find out the pattern. Most of the issues occur because of memory allocation versus how your GC is able to reallocate memory back. This can be analysed by collecting GC verbose. There are lot of options available with JVM options (click on this link to get the details) to collect GC details.
Note: Some of the JVM might vary, so refer JVM documentation for the particular vendor
Common option is
nohup java -Xverbosegc:file=testgc.vgc com.test.TestServer > test.out &
Executing this will store the GC collection metrics in testgc.vgc file. Run your load test.
Once completed there are numerous tools available to analyse GC details. I used HPJmeter and download is available in this URL.
This tool will provide details of your application memory management details and how GC works on your application run time? We can get,
1. Heap usage
2. Scavenge
3. Full GC (Perm gen)
4. Object creation rate
5. How many times scavenge and full gc executed
6. How much reclaimed each stage
Steps to be taken care:
1. This has given great insight of the application, store this metrics in your repository for further tuning.
2. Include the scenario to load test. Once OOM occur, that application moves to hot seat, so every release plan to run stress and load test
3. This is clear indication that, your application need to go through profiler.
How to debug OOM? Development phase is over, application has been tested by QA and moved to Prod. It runs fine/up for first few days or even month. Suddenly it stops with OOM. Some careful step by step analysis will help to solve this kind of problem.
Suspects:
1. Check log to understand what happened at the time of OOM, was there any particular functionality executed many times?
2. Is there any change in load? has it been increased in past days?
3. What are all new changes done to application?
4. Is there any specific changes to hardware?
5. Any other new application deployed into the same box recently which consumes your application memory also?
Above questions would give some clue on what could be the reason?
1. If it is some functionality and that leads to OOM, then go through the functionality and try to get how the objects are kept in memory.
For example, might have assumed always we need to get the details from 2KB files, so lets load them into memory and get details from that. But over a period of time this could have increased to 10MB?
2. System load can be mostly collected from the run time details / even from the log. Get the snapshot of CPU usage and memory usage from Production management team (like, UNIX command top snapshot)? Database entries also gives fair amount of load, like how many entity has been added today?
3. Definitely new changes might be the root cause, if the application is not new. Carefully go through each functionality added to last release?
4. Check with the Production Management team about the hardware changes / patch releases to OS / upgradation? any of this can also cause
Reproduce:
Based on suspect develop test application
1. Each suspect need to be verified in similar environment
2. If it is load issue, find out heavy weight functionality and load test. Increase load step by step (like, 20 clients 1000 requests then 40 clients 2000 requests)
Analysis
Once the problem has been reproduced in your environment, find out the pattern. Most of the issues occur because of memory allocation versus how your GC is able to reallocate memory back. This can be analysed by collecting GC verbose. There are lot of options available with JVM options (click on this link to get the details) to collect GC details.
Note: Some of the JVM might vary, so refer JVM documentation for the particular vendor
Common option is
nohup java -Xverbosegc:file=testgc.vgc com.test.TestServer > test.out &
Executing this will store the GC collection metrics in testgc.vgc file. Run your load test.
Once completed there are numerous tools available to analyse GC details. I used HPJmeter and download is available in this URL.
This tool will provide details of your application memory management details and how GC works on your application run time? We can get,
1. Heap usage
2. Scavenge
3. Full GC (Perm gen)
4. Object creation rate
5. How many times scavenge and full gc executed
6. How much reclaimed each stage
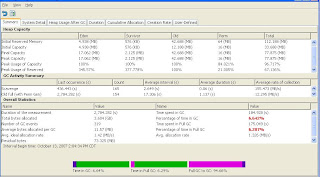 The above output is just summary. Now analysis revealed problem, then how to solve?
Solution:
We can fix code and release it, but how long this problem is going to wait? Are you ready to face CNN interview? We need short term solution. This can be either,
1. Increasing heap memory
2. Tuning configuration parameters (JVM options)
a. can specify what kind of algorithm can be used? (ex, -XX:+UseParNewGC -XX:+UseConcMarkSweepGC -XX:+CMSIncrementalMode -XX:+UseTLAB)
b. how much memory needed for tenure (ex, -XX:MaxTenuringThreshold=40)
c. How long it needs to stay in scavenge (ex, -XX:SurvivorRatio=2)
d. Most importantly check, is it enabled for server mode (ex, -server)
3. Tune application level configuration (ex, in one case, we could solve the problem by just decreasing logging level)
Confirm stability:
Now based on your above solution, apply in your environment and run test again. Collect GC details and compare with the OOM result
Most of the tools provide compare option and more over memory allocation and CPU usage can be monitored using top command in UNIX/LINUX.
Heap Memory comparison result, Red indicates OOM issue process
Object creation rate graph comparison Conclusion:
Steps to be taken care:
1. This has given great insight of the application, store this metrics in your repository for further tuning.
2. Include the scenario to load test. Once OOM occur, that application moves to hot seat, so every release plan to run stress and load test
3. This is clear indication that, your application need to go through profiler.
Thursday, October 18, 2007
https - GET URL is it safe?
We had discussion yesterday about https - is it really secure when the URL contains GET method data? Yes, it is secure because in case of https browser makes connection to server with Host and port, so this information is open to all. But the details like URL and GET details are encoded and passed to the server. So https is secure even with the GET method submit.
But can we use GET in secured application? I would say no, definetly not to pass sesitive details as part of URL, someone uses the URL at sharing machine it becomes security issue. We can copy the details from browser history :(
Found this link interesting
But can we use GET in secured application? I would say no, definetly not to pass sesitive details as part of URL, someone uses the URL at sharing machine it becomes security issue. We can copy the details from browser history :(
Found this link interesting
Wednesday, October 17, 2007
Converting sysout to logger - entire application
We never worried about sysout statements in java, jsp codes, when we started development of web application in 2000. It has grown such a way that around 2000 files of java, jsp, js and html. User base also increased drastically from few hundreds to thousands. Always atleast 150 parallel sessions running on. This is just a history
One fine day, OOM (i love this term) Out Of Memory occured. This application has been migrated to tomcat and we disabled catalina.out by redirecting output to /dev/null. This is because catalina.out file started growing in GBs. Now how do we debug OOM, there is no out file :(
Here is where, we realised sysout issue. What a mistake, we should have used logger for this. Anyway how to solve? We discussed couple of options, writing a custom pearl script to comment out set of files. Take it as a manual tasks.
Luckily Eclipse has option to search and replace multiple files
- Check out all the files from repository
- Setup java project for application
- Select Search > File option
- Enter System.out.print as containing text
- File name patterns as “*”
- Click on Replace
- Enter "Logger.debug" as replace String
- Select replace all to replace in all files
- Update to repository and commit
Friday, October 12, 2007
How to display line number in JAVA at runtime
I have seen code with sysout statements to debug like Error 1, Error 2. This is good idea to debug the code easily instead of checking log files. I was wondering if we can get the line number of java code that would be great to debug.
public class TestLineNumber {
public static void main(String[] args){
int x = 10;
System.out.println("X value is "+ x
+ " at line number "+ new Exception().getStackTrace()[0].getLineNumber());
x++;
System.out.println("X value is "+ x
+ " at line number " + new Exception().getStackTrace()[0].getLineNumber());
x++;
System.out.println("X value is "+ x
+ " at line number " + new Exception().getStackTrace()[0].getLineNumber());
}
}
Output will look like below:
X value is 10 at line number 6
X value is 11 at line number 9
X value is 12 at line number 12
Wednesday, October 10, 2007
To get constraint details - oracle SQL
We cannot display all the constaint details in the DB code, so most of the time it just provides constaint name. Need to get the actual details from the database. It would look somthing like below, owner is the schema owner name.
select * from all_cons_columns where owner = 'DEVDBA'
and constraint_name = 'VALID_YES_NO481';
If needed we can get all the constraint applied to the table by executing below query
SELECT * FROM ALL_CONSTRAINTS WHERE TABLE_NAME='SALES' and owner = 'DEVDBA'
select * from all_cons_columns where owner = 'DEVDBA'
and constraint_name = 'VALID_YES_NO481';
If needed we can get all the constraint applied to the table by executing below query
SELECT * FROM ALL_CONSTRAINTS WHERE TABLE_NAME='SALES' and owner = 'DEVDBA'
Friday, October 5, 2007
How to find out of number connections to Oracle
This queries are mostly used at the time of real QA. I rarely use this query, so i had to write down somewhere to refer.
To find out total number of connections to ORACLE
select count(*) from v$session
To find out machine details and number of connections
select machine,count(*) from v$session group by MACHINE
if you dont have previlage to view this table, work with DBA and get it done.
To find out total number of connections to ORACLE
select count(*) from v$session
To find out machine details and number of connections
select machine,count(*) from v$session group by MACHINE
if you dont have previlage to view this table, work with DBA and get it done.
Thursday, October 4, 2007
Nothing new - Debugging UNIX Java process
Nothing is new here. Bits and pieces put together to debug Java process on resource management, thread dump and manually kill the process. I always develop software on Windows platform, but need to port to UNIX platform. Once moved to UNIX, ya hoooo... i see problem. How to solve ? :(
Step 1: Find out process id. Use "ps" command and "grep" command, this works great
Linux:
ps -aef | grep <java execution>>
Example: ps -aef | grep com.test.TestRunner
HP Unix:
ps -aefx | grep <java execution>
Result:
test 17559 17548 0 Oct01 pts/1 00:00:00 -ksh
Now get PID (Process ID) from the result, second column indicates process id (third column is the process which started this process)
Step 2: Find out what are all the resources used by the process (all the socket connections)
lsof -p <PID>
Example: lsof -p 17559
This result will give number of open files, TCP connections and UDP connections. This gives better insight of the process and its current status. We can solve most of the issues by seeing the resource usage snippet.
Step 3: This isnt enough to conclude, need to get better idea of the process. Get a thread dump.
kill -3 <PID>
This will not kill the process, this will dump output into .out files. Always start the process by redirecting results into .out file
nohup java com.test.TestRunner > testrunner.out &
This gives great insight of each thread and dead lock details.
Step 4: We are done with the analysis, need to start the process again to find out other problems :) , so kill the process
kill -9 <PID>
SIGQUIT is also another way to debug, i used long before dont remember now.
Wednesday, October 3, 2007
Resource release rule as part of code review
Most of the time incorporating code review as part of build process is not very successful because below reasons
1. Sometimes we run build script by disabling this option
2. Sometimes we ignore the result and continue with the build
3. End up little time to fix issues
To avoid such problems, it is always good to incorporate code review step as part of development. This is very useful to find out major issues such as releasing resources, memory management and design related issues. We may not be able to run full code coverage testing all the time.
Above issues can lead to fatal, because same resource needs to be accessed by multiple applications in integration environment. Other team testing/development will also be affected because of this problem.
We often wrap the resource classes and release as a common package. Simple example is I am sure each and every company must have their own db package with connection pool. So code review tool has to be customized to incorporate resource release for the wrapper classes. Found PMD is very useful for Java code review.
PMD can be integrated with Eclipse and can be customizable to deifne our own priority.
Step by step setup:
http://www.devx.com/Java/Article/31286/0/page/1
How to customize rule?
http://www.onjava.com/pub/a/onjava/2003/04/09/pmd_rules.html
Customizing resource release rule for wrapper class, Once installed enable PMD for the particular project in Eclipse.
- Goto Window > preferences > PMD > Rules Configuration
- Select closeResource and change Priority to “Error High”
- Add types and closeTargets
- types represents – Object name (like DBPool)
- closeTargets – represents method name to release the resource (like close,destroy,disconnect)


Once it is done, rules can exported and distributed to others.
I found following are good about using PMD with eclipse
1. Whenever code is saved it will be executed in Eclipse and developer can correct at the time of development itself
2. Same can be incorporated with build process also
3. Most of the issues are closed at the time of coding
Building Unix code in windows - ant
Thanks to java portability. This helps to develop code in Windows system and deploy in UNIX system. But sometimes it brings some more steps to be included to ant build script. Most of the time need to run dos2unix and make it as executable (mode) at the time of deployment. This can be easily controlled by adding below steps in ant script.
Removing special codes from executable files, so that it will be compatible with UNIX system.
<fixcrlf eof="remove" eol="lf" includes="**/*.sh" srcdir="${src}">
Replaces EOLs with LF characters and removes eof characters from the shell scripts. Tabs and spaces are left as is.
Changing the file type as executable by setting mode=755 at the time of tar
<tarfileset dir="${src}" mode="755" prefix="/bin">
<include name="runScript.sh">
</tarfileset>
Sample ant build script:
<?xml version="1.0" encoding="UTF-8"?>
<project name="doscommands" default="test" basedir=".">
<target name="test" depends="">
<echo message="Fixing dos2unix"/>
<fixcrlf srcdir="." includes="**/*.sh" eol="lf" eof="remove" />
<echo message="Fixed dos2unix"/>
<echo message="Fixing chmod to 755"/>
<chmod dir="." perm="755" includes="**/*.*"/>
<echo message="Fixed chmod to 755"/>
</target>
</project>
Subscribe to:
Posts (Atom)
